Active vs. Passive: What This Year's Scorecard Really Says

Twice a year, the investment research company, Morningstar, publishes one of the most closely watched scorecards in the investment industry, pitting thousands of professionally managed funds against their low-cost index equivalents to see which side is actually winning. It's a genuinely useful study, and it's essential reading if you want to understand what's actually inside a portfolio and why. The latest edition covers more than 9,000 funds holding roughly $29 trillion — about two-thirds of the entire US fund market — making it about as complete a report card as exists on this question.
One quick but important definition before the numbers: a fund only counts as a "success" here if it did two things — stayed open for business, and beat its passive equivalent. That first part matters more than it sounds. Fund companies quietly close or merge away their worst-performing funds all the time, which would flatter the numbers if you only looked at the survivors still standing today. This report counts a fund that got shut down as a loss, not as a rounding error — which is exactly why the results below are more trustworthy than the "look how many winners we have" stats you'll sometimes see in a fund company's own marketing.
The number to actually remember
Zoom out to a full decade, and only 25% of active funds managed to survive and beat their passive equivalent. Put another way: pick an actively managed fund at random 10 years ago, and roughly 3 times out of 4, you'd have been better off in the boring index fund. That's up slightly from the year before (21%), but it's still the headline that matters most for anyone thinking long-term.
The past year, though, was unusually good for active managers
Here's where it gets more interesting. Over the most recent 12 months, active funds overall had their best showing in a while — a 40% success rate, up a meaningful 7 percentage points from the year before. But that average hides huge differences by category:
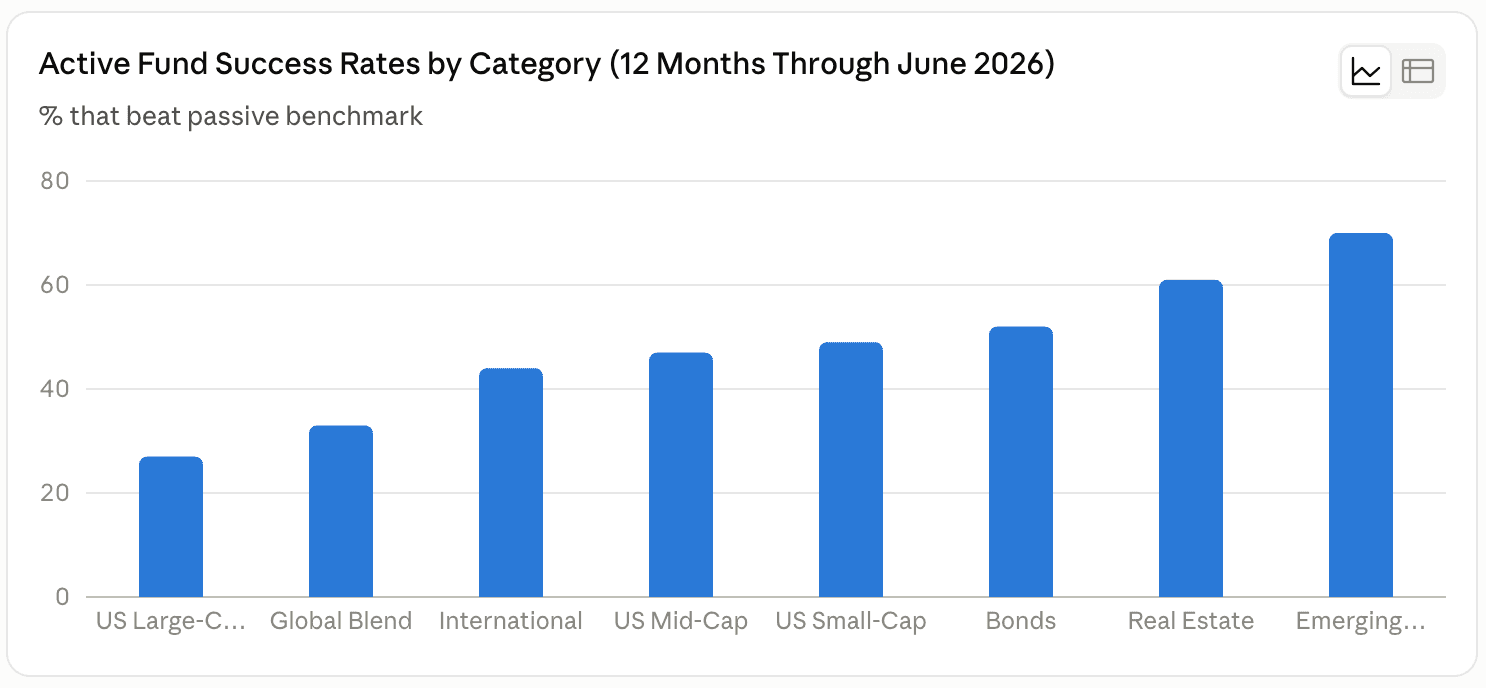
The pattern is clear: the bigger and more heavily researched the market, the harder it is for an active manager to find an edge — and the more obscure the corner, the better their odds.
Where active managers struggled most: US large-cap stocks. Only 27% beat their index equivalent this year, and it's historically the weakest long-term category too. That's not a coincidence — large US companies are the most scrutinized, most written-about, most traded investments on Earth. Thousands of analysts pick over every one of them daily, which leaves very little mispricing left for a fund manager to exploit.
Where active managers had a genuinely strong year: everywhere less crowded. Emerging-market stock pickers had a remarkable run — 70% beat their passive benchmark, a 35-point swing from the year before. Real estate funds jumped 36 points to 61%. Bond managers overall rebounded sharply to 52%, with intermediate-core bond funds hitting 66%. Smaller and mid-sized US companies also gave active managers better odds than their large-cap peers. The common thread: markets that are researched less thoroughly, or move on factors beyond simple stock-picking, tend to leave more room for genuine skill to show up.
What tells you more than the category: how much you're paying
Two things in this report were reliable predictors of success, and only one of them is something you actually control.
The first is cost. Over the full 10 years, 33% of the cheapest active funds beat their benchmark, compared with just 20% of the priciest ones. Fees come straight out of your return every single year, whether the manager has a good year or not — so the math tilts in your favor before a single investment decision is even made.
The second is what happens when you're wrong, not just how often. For large-cap funds, when a manager underperformed, they tended to lose by more than a winning manager gained — a bad trade-off stacked on top of already poor odds. For bond funds, it ran the other way: winners tended to win by more than losers lost. Category odds and payout size both matter, not just the headline win rate.
A reassuring wrinkle, if you already own active funds
Here's a genuinely encouraging detail buried in the data: when Morningstar weighted results by actual dollars invested rather than counting every fund equally, real investor money beat the "average fund" figure in 16 of the 20 categories studied over the past decade. In plain terms — successful funds tend to attract more money over time, so investors as a group have generally leaned toward the stronger performers, not been spread evenly across the good and bad alike. It suggests people (or their advisers) are, on the whole, making better-than-random choices.
The takeaway
For a market as picked-over as US large-cap stocks, the data makes a strong case for simply owning the index — the odds of an active manager clearing that bar, and staying open long enough to prove it, are genuinely poor. In narrower, less efficient corners of the market — smaller companies, emerging markets, bonds, real estate — active management has better historical odds, though "better odds" still isn't a guarantee, and this year's standout categories won't necessarily repeat next year. The one lever you can pull with total certainty, in any category, is cost — and this report backs that up as clearly as anything else in it.
Ready to Take the Next Step?
Enjoyed this article?
Get the next one delivered to your inbox.
Comments
Loading comments...
Related Articles
Continue reading more insights on financial planning.

Investment Risk: The Risk Of Low Returns And Falling Short Of Your Financial Goals

8 Warning Signs You're Talking to the Wrong Financial Adviser